
2023 Val Nav Release Notes
New Features
Introducing the ValNav Community
We are excited to launch the Val Nav Community, which will be the best way to stay informed about the exciting things coming to Val Nav, engage with your peers on how they view industry problems and interact with the Val Nav product team so your voice is heard for future development items.
Featuring our new quarterly Customer Advisory Board, regional User Groups, new feature Focus Groups, Release Announcements, and much more, the community will be the perfect place to learn, discuss, and engage with all things Val Nav.
Sign up here: https://forms.office.com/r/aZWYMhFqbU
Capital Cost Lookups
Economic modeling leaps forward in Val Nav 2023, with a new method to model capital costs. Now, capital costs can be genericized as models that are assigned for wells to reference.
Sharing the same structure as price decks, updating the capital cost lookups automatically update all wells that use them. Sensitivities can be created just by running different capital cost decks without any change to the wells.
Even better, lookups are built relative to an anchor date on the well so capital costs are scheduled dynamically. As each well's schedule evolves, Val Nav updates the capital based on the updated anchor date requiring no extra updates from the user.
Capital decks will also be subject to separate security permissions. Altogether this means that capital modeling will be more efficient, trusted, and connected than ever before.
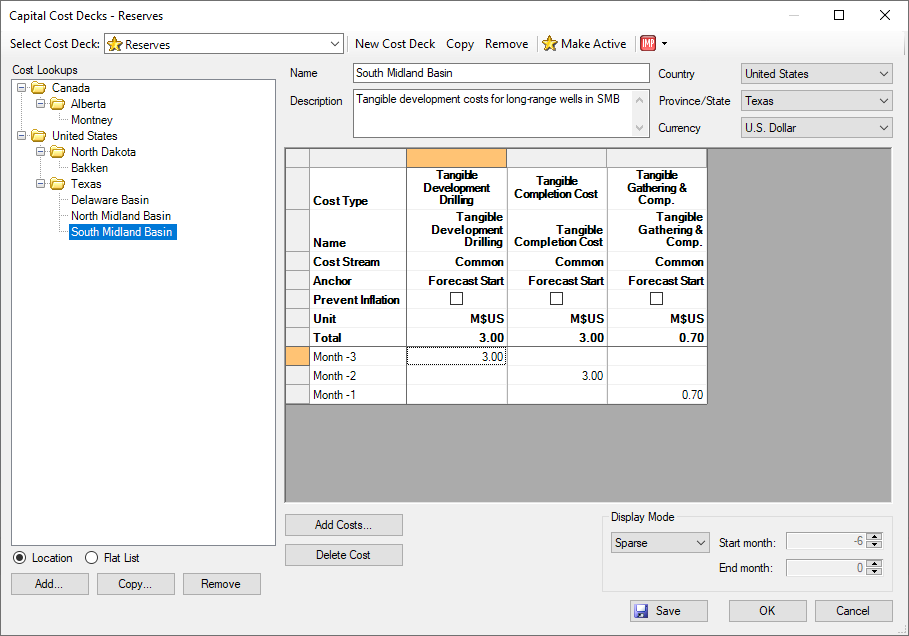
Click image to expand or minimize.
Technical Comparison tab
The technical comparison tab has been overhauled to offer an outstanding new forecast visualization and comparison experience. From lookbacks to reserves, maturation to cross-department comparison, the reinvigorated tab offers comprehensive comparison for every forecast your company generates. Highlights include:
- Quick modes to compare across archives, plans, and reserves categories
- On-demand rollup and multi-well comparison simply from hierarchy selection
- Project-defined colouring for consistency and management-grade presentations
- Graph translation layer to use your own custom graphs for comparison
- Modernized UI, data tables, data point tracking, and more!
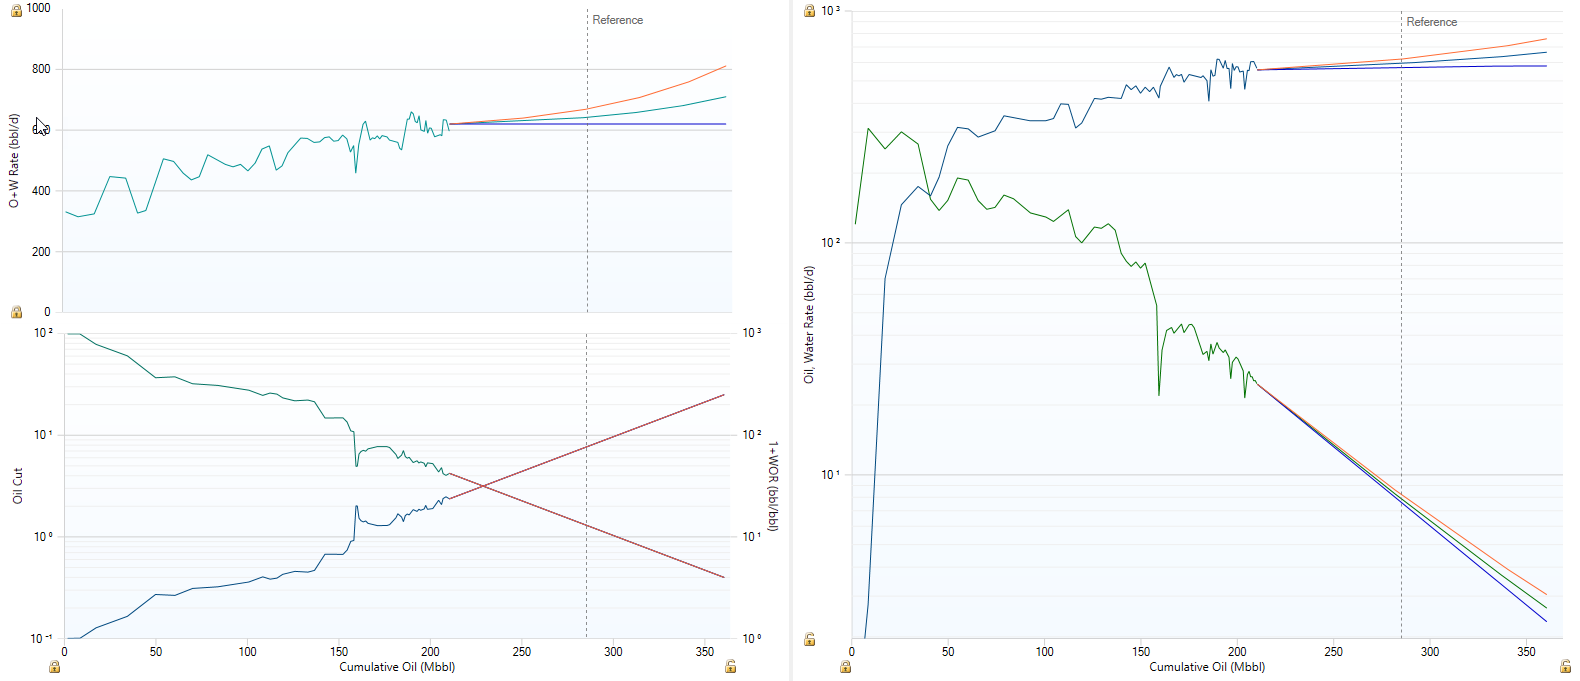
Click image to expand or minimize.
Daily Forecast Report Plug-In
Val Nav can now generate true daily forecast results with a new release plug-in that leverages Val Nav’s daily decline engine. When installed, a new "Daily Forecast Report" is available that can generate daily results across a specified date range or duration from the forecast start. It can also optionally aggregate or expand child forecasts when run on a folder level. The daily results combined with the flexibility of the report facilitate a variety of use cases:
- Understand the impact of high-rate wells or pads coming online against facility constraints.
- Provide more accurate daily projections for pipeline commitments or monthly outlooks.
- Export results to CSV for presentation or analysis.
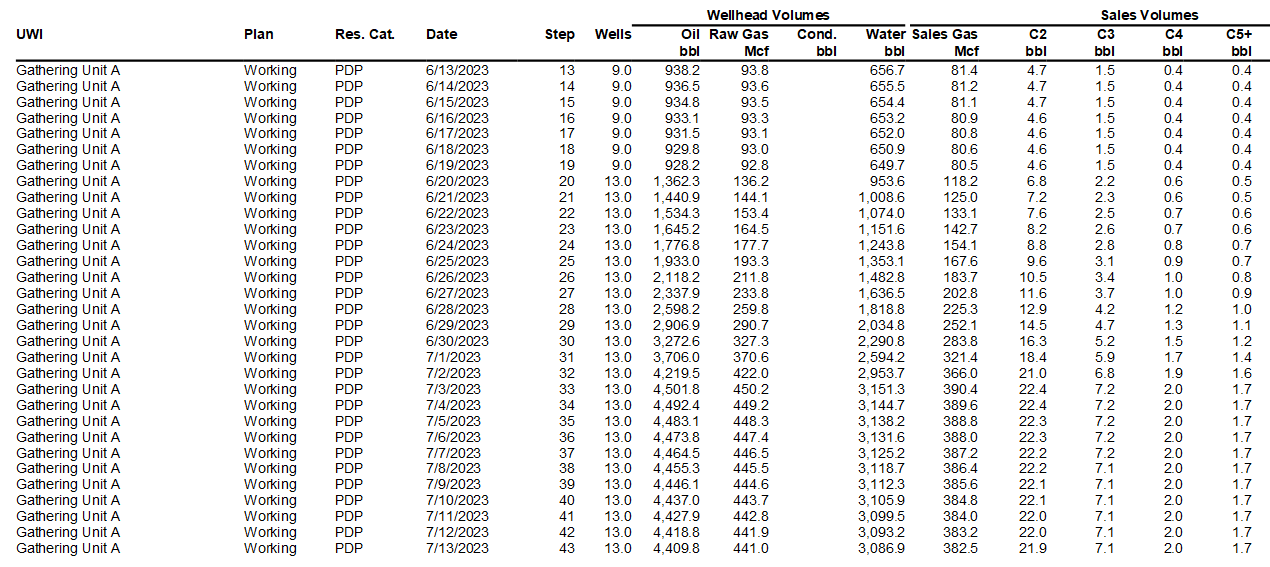
Click image to expand or minimize.
Re-forecasting Reimagined
Val Nav 2023 also adds thoughtful improvements to the re-forecasting effort engineers tackle so often throughout the year:
- New intuitive axis dragging on the decline tab allows engineers to easily scale graphs.
- Graph-based fits have been re-imagined, placing engineers in a multi-product workflow. Once the first product is fit, the user can evaluate the result and hit the tab key to cycle to the next product or ratio defined on the graph.
- Fit options have been expanded to allow the user to control rate matching done during fitting routines including options to always match the last historical rate, ignore the latest rate in favor of the established trend, or use Val Nav's proprietary calculated rate matching.
GIF demonstration. Click image to expand or minimize.
Forecast by Exception Window
The Forecast Variance plug-in created a powerful workflow to focus re-forecasting efforts on the wells whose forecasts deviated most from new production history import. By calculating the variance between history and forecast, binning the result, and writing it to a custom field, wells could be organized by their deviation from history in the user's hierarchy.
Val Nav 2023 brings the plug-in into the application and elevates its functionality with project-level options to control the duration of overlap used and products to run on. Now, users can simply update variances directly from the Forecasts menu and focus on re-forecasting the most deviated wells.
“Last year for economic monthly output” Setting
The “Last year for economic monthly output” setting has been moved from the project level to the scenario level. The number of years to store monthly data directly affects economic calculation times due to the greater volume of data to persist. Now, users can customize their scenarios to run faster and store less data than the global setting.
Project-defined Colouring
Alongside the technical comparison work, colours can now be defined for objects used in comparison across a project including plans, reserves categories, archives, entities, and custom fields. This will allow more consistent and meaningful colours to be generated for comparison and analysis work done in the new technical comparison tab, cross plot tabs, and map.
Well Data XML Optionality
Users now have more discretion when exporting well data via XMLs for more fit-for-purpose communication between projects. Now, the exact well data can be specified, such as whether to include well attributes, daily history, vendor IDs, and more. This also makes exports much faster when no time needs to be spent exporting data redundant to the target project.
Hierarchy Navigation with New Keyboard Shortcuts
Hierarchy navigation has been streamlined with keyboard shortcuts to expand/collapse all or currently selected nodes.
- Ctrl-right - Expand all nodes
- Ctrl-left - Collapse all nodes
- Shift-right - Expand currently selected nodes
- Shift-left - Collapse currently selected nodes
Filter and Search in Data Views
Data view template building and re-organization is much faster with a new "Type to Filter" search, quick filter to all selected values, multi-select drag and drop, and move to top/bottom context menu options.
Keyboard Shortcut to Flag Wells
A keyboard shortcut can now be used to flag wells (Alt+F). The behavior of flagging has also been adjusted to allow toggling flags on and off, as well as flagging from a folder level.
Plug-in migration
Most of our most popular plug-ins have been migrated into the main application for simpler IT deployment:
- Delete Production Data
- Update/Remove Change Records
- Behind-Pipe Scheduling
- Val Nav Indicators
Enhancements
- To avoid unintended model changes or potentially corrupting data, XML import security was adjusted to disallow imports with differing Reserves Category models if there are no entities in the database. Model changes now must be done in the reserves category dialog.
- Introduced the ability to color analog wells based on well attributes.
- User options have been reorganized to consolidate all forecast-related options together.
- Added a new "Set Start of Forecast" option to shift forecasts to the day after the last production month. This new mode accommodates users that are uninterested in shifting all forecasts to the current month and instead expect continuous declines of non-shut-in wells.
- Introduced a new security policy controlling which users can modify the Reserves Category model. Upon upgrade of an active database, users that can Modify Global Project Data will inherit this policy as well.
- Meter station information has been updated.
Fixed Defects
- Enabled the "Draw Profile" fit method to use the active decline display setting.
- Fixed an issue where a secondary ratio termination could be incorrectly determined by using an Oil Cut max fluid rate rather than an existing O+W forecast.
- Fixed an issue where a well with only GOR, WOR, and O+W projections could yield no volume in the first month.
- Changed behavior to disallow price decks from being deleted if used in an existing scenario rather than removing those scenarios too.
- Fixed an issue where opening a project last closed on the Timeline tab could cause a crash.
- Fixed an issue where the calculated duration of certain oil cut uses did not align with the correctly calculate forecast results.
- Fixed an issue where certain ratios would fail to calculate if a user-entered Qf was only slightly higher than Qi.
- Fixed an issue where net remaining reserves in wedge categories could exclude results in timesteps without cash flow generation.
- Fixed an issue where raw gross gas volumes would reduce to 0 when 100% loss is applied in the plant tab.
- Fixed an issue where certain ratios could not calculate an inclining decline rate to meet a given Qi and Qf.
- Fixed an issue where certain economic indicator behavior was dependent on the "Pro-rate taxes" report setting.
- Fixed an issue where selecting the data view right after changing the product selection in the type well graph could cause a crash.
- Fixed an issue where analog selection on type well graphs selected incorrect wells.
- Fixed an issue where analog selection in the type well graph reset the zoom on the graph.
- Fixed an issue where the data point tracking icon could disappear from the toolbar.
- Fixed an issue where economic results from an unaffected reserves category could be incorrectly marked as stale.